TestMasters LSAT Preparation
Unmatched Expertise
TestMasters founder Robin Singh has a world‑record twelve perfect LSAT scores and has personally taught over 10,000 students in live class settings. No one has a deeper understanding of the test or a more effective system for attacking it.
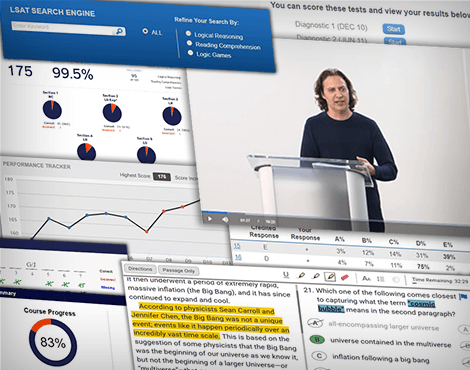
Amazing Resources
Our comprehensive LSAT prep materials are the product of decades of research and development. We work hard to give TestMasters students every possible advantage.
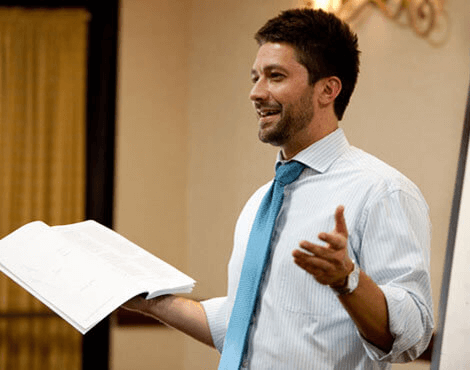
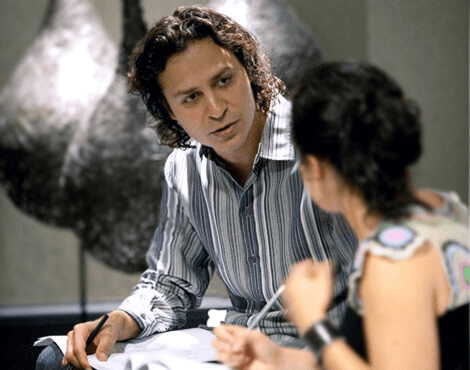
The Best Instructors
Through extensive screening, rigorous training, and excellent compensation, TestMasters has built the greatest LSAT faculty ever. Our teachers go above and beyond to help their students succeed.

Proven Success
In the past 30 years, TestMasters has helped hundreds of thousands of students achieve spectacular LSAT score increases.